
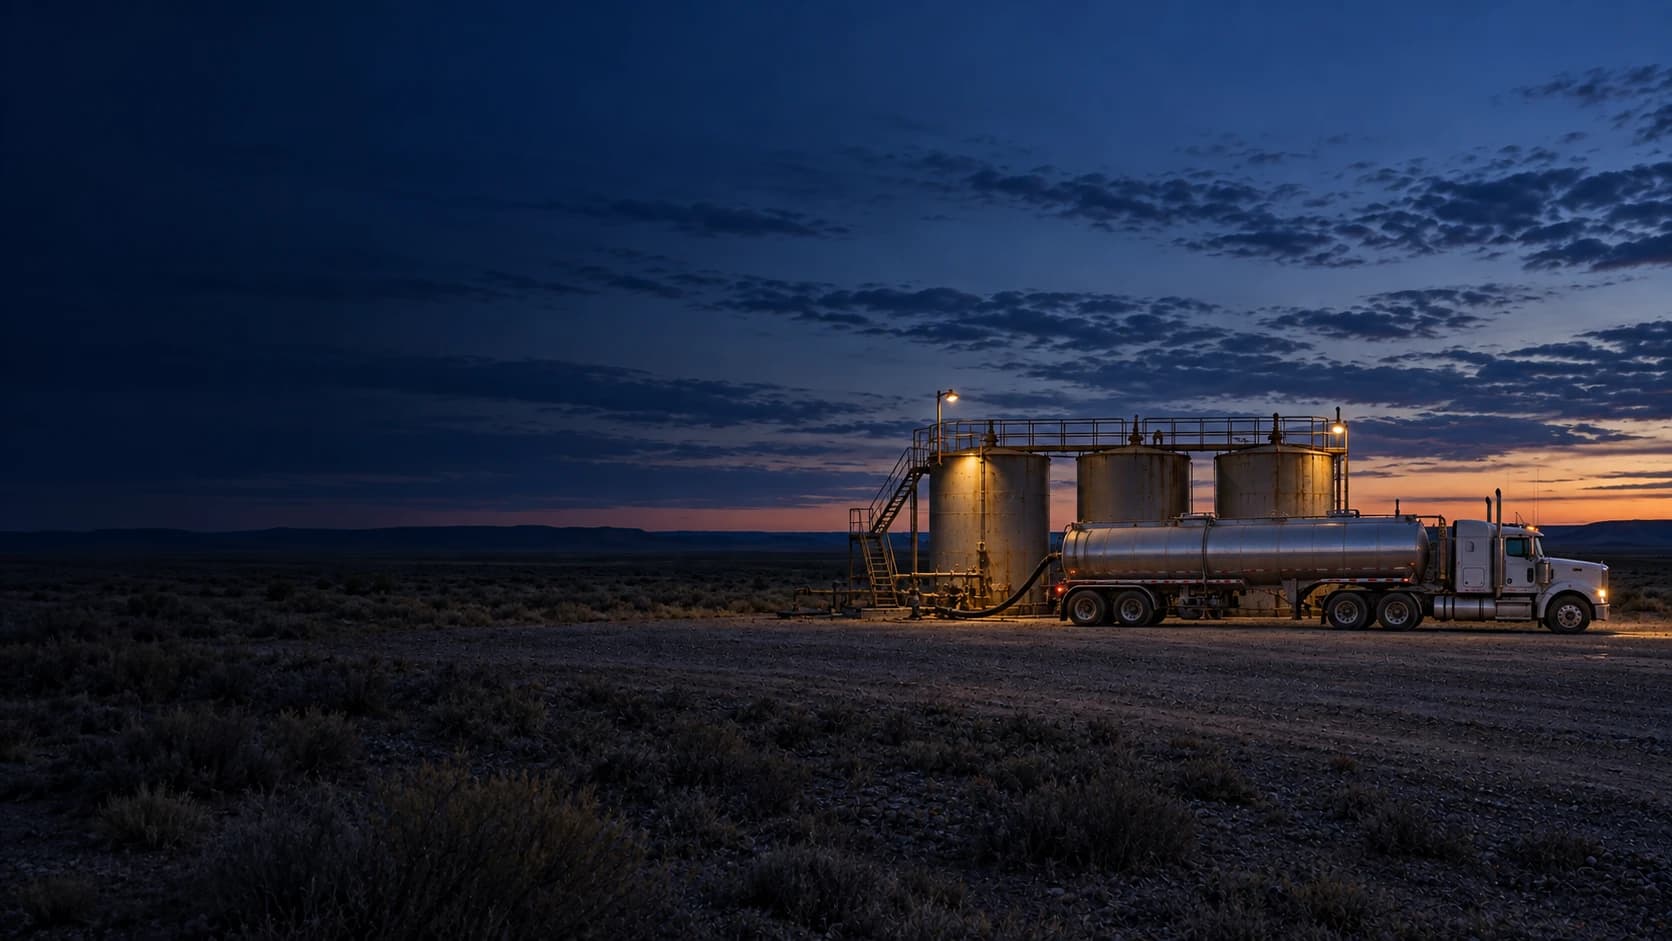
Track your production, per well
Allocate, measure and track your production using our sensors and your manual readings.
Your field reports. Our sensor data. One production ledger.
Bring automated tank readings, on-site gauges, and run tickets into one shared record of production.
Tank charts
OilHover or tap to inspect a reading. Use the arrow keys when focused. Swipe to explore on mobile.
We keep track, even when you can’t make it on site.
Our sensors keep recording between visits. When your pumper is back on site, they can view the tank, enter a gauge, and review its production ledger right from the Amplified app.
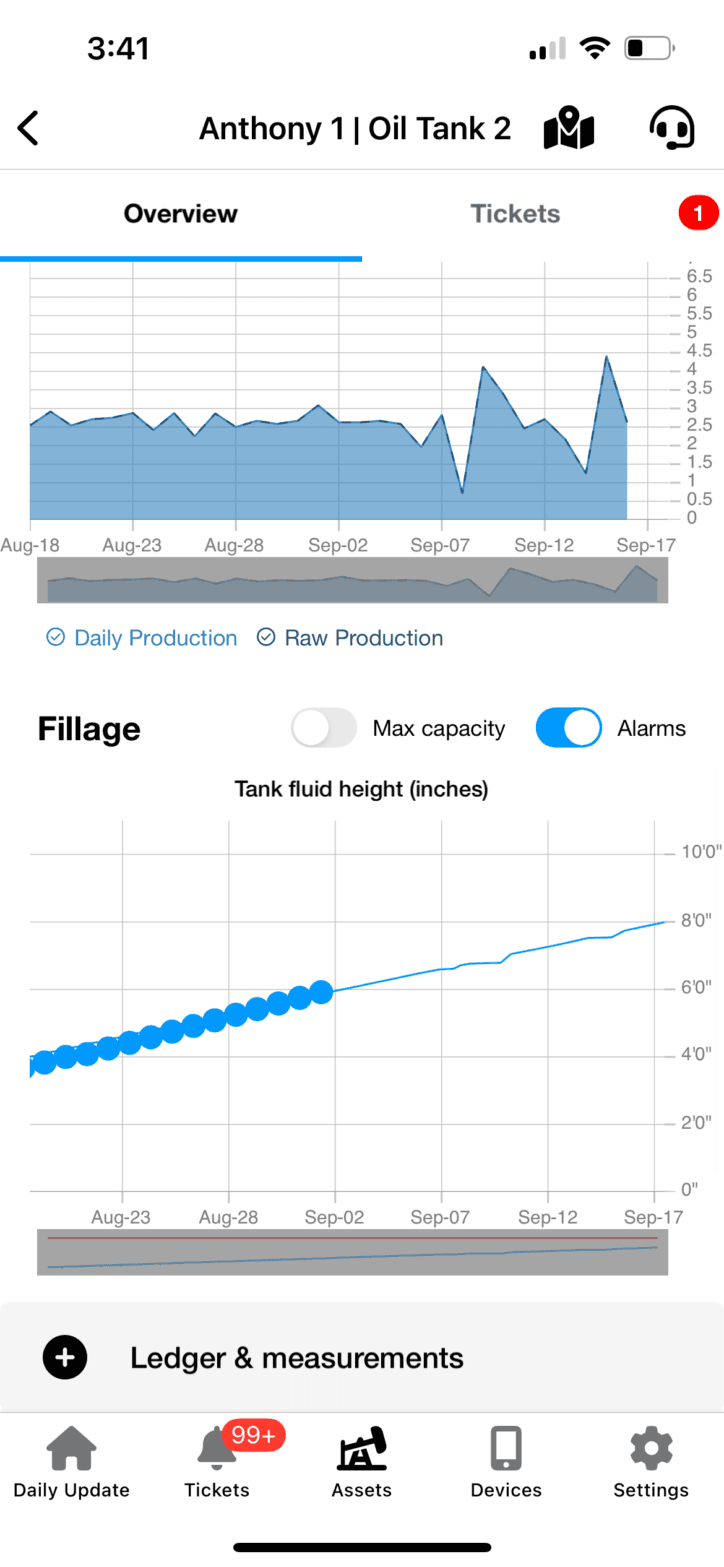
See the tank. Add a gauge.
Check tank levels and record an on-site measurement from the same app.
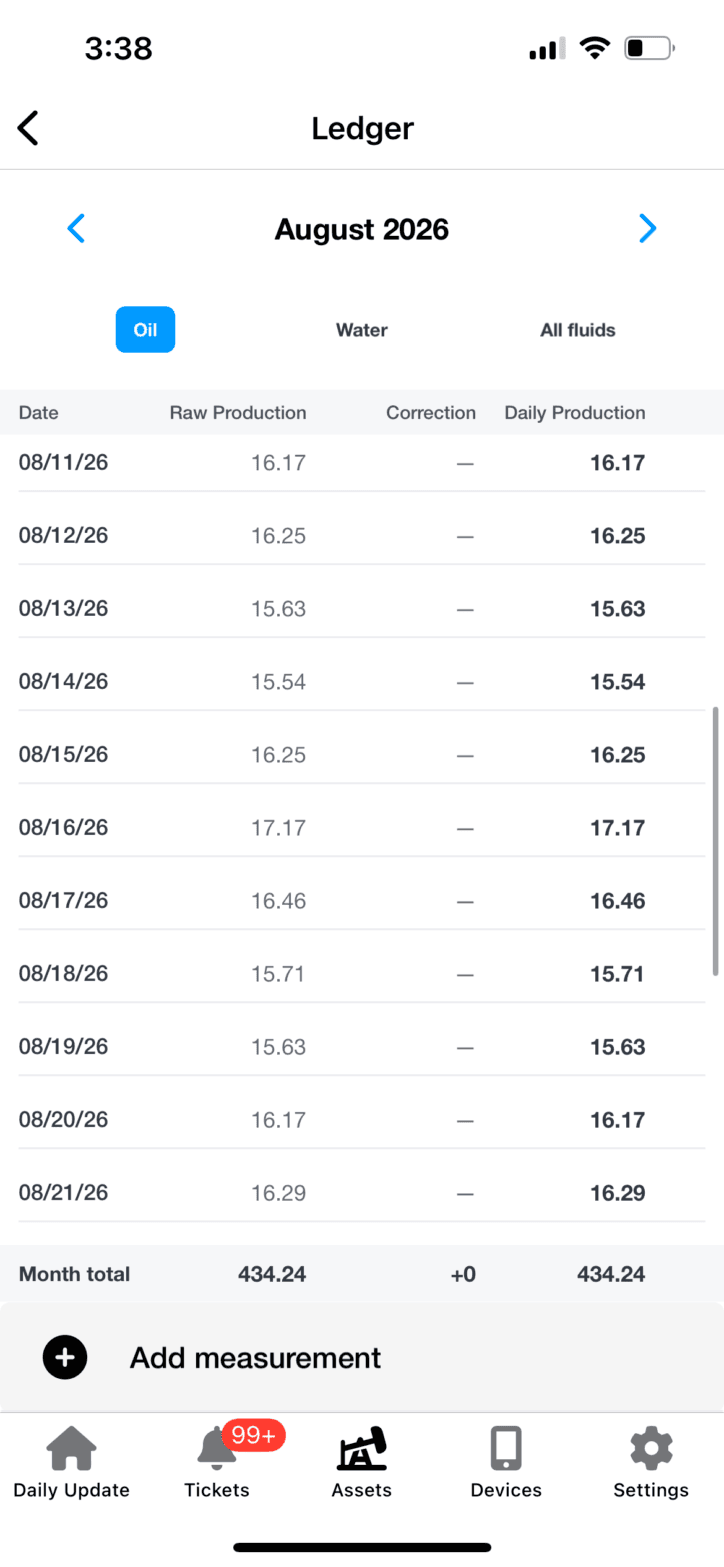
One ledger for the whole crew.
Review daily production, corrections, and monthly totals wherever the job takes you.
Capture field data and tickets
Collect readings with sensors or the Amplified app. Create field tickets to record what happens on site.
Import production in one click
Bring in production reports from hauling companies and other production software with one click.
Generate sales and production reports
Track field-wide performance and prepare reports to submit to regulatory agencies.
Numbers you can count on. Know which wells need you.
Turn production data into a prioritized field visit. Compare each well with its target, spot the ones falling behind, and focus your crew where attention is needed most.
Production watchlist
Illustrative data · Fictional leases and wells
Select a well to investigate its production.
| Lease / well | Actual | Target | Variance |
|---|---|---|---|
| 14.2 | 23.0 | -38%Needs attention | |
| 9.8 | 15.0 | -35%Needs attention | |
| 17.4 | 20.0 | -13%Needs attention | |
| 26.1 | 26.0 | +0%On track | |
| 11.6 | 11.5 | +1%On track |
Oil rates in bbl/day. This demo flags wells more than 10% below their current target.
Cedar Creek / Cedar 04
Daily production against expected performance
8.8 bbl/day below target
Production has fallen behind expectations. Review downtime, recent gauges, and run tickets to decide where your crew should go next.
Set the expectation
A target that follows the well.
Set an exponential decline curve, or estimate a trend from historical monthly averages. Compare production with an expectation that accounts for natural decline.
- Curve type
- Exponential decline
- Initial oil rate
- 23.0 bbl/day
- Monthly decline
- 4%
Production counted four ways
Inferred from pump cards, measured at the meter, computed from tank level, and allocated to wells from lease totals using well tests with runtime weighting. The platform runs all four and shows you where they disagree.
Allocated to each well
Record well tests for each asset and lease production is allocated back to every well, weighted by runtime, with downtime taken from the sensors or from your logs.
Targets, and alerts when you drift
Set production targets per lease, well, or tank. Performance is measured against them continuously, and an alert opens a ticket when a lease drifts off target rather than at month end.
The ledger: a report of the oil sold
Run tickets recorded with opening and closing gauges, sold volume, and a photo of the receipt. Load-outs measured rather than estimated, and a monthly report of oil sold built for you.
See what each well contributes.
Estimate production stroke by stroke, or allocate measured lease production using well tests. View either method, or compare both for the same asset.
Well charts / Cedar 04
Cedar Creek · All fluids · Aug 17 – Sep 17
Inferred production
Every stroke tells a story.
We combine stroke-by-stroke information with rod design, strokes per minute (SPM), and pump fillage to estimate the volume each well produces. See changes in estimated output as operating conditions change.
Allocated production
From the lease to each well.
Use well-test results to allocate measured lease production across individual assets. Each well gets its share of the lease total, giving your team another view of its contribution.
Join the revolution
Eliminate spills, boost your profits and reduce failures with AI built for the oilfield. Let’s talk about what your operation needs.
Explore more solutions
Dashboard
One dashboard and one mobile app for the whole fleet (wells, tanks, meters, compressors, and cameras), a single source of information to manage the field from.
Threshold alerts
Real-time alarms across every data channel. Set your thresholds, flag the exceptions, and let connected equipment act before a small change becomes a bigger problem.
POC integration
Supercharge your existing POCs, VFDs, flow computers, and legacy SCADA, and bring them into the Amplified Industries ecosystem.